目次


作るもの
以前、自分用のZigZag的なインジケータを作ってみましたが、いまいちな結果で終わってしまいました。
そこで今回は、前回とは別アプローチで波形を描いてみようと思います。
今回の高値・安値の決め方は以下のとおり。
- 平均足が陽線から陰線に切替わったら、直前の陽線群の最高値の点を追加
- 〃 陰線から陽線に 〃 、直前の陰線群の最安値の点を追加
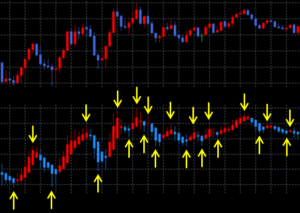
図の矢印の高値・安値を結ぶことになります。
これで、まあまあいい感じの波形になってくれないかと期待しています。
実装
技術的に目新しいことは特にないので、ソースコード全体だけ載せます。
//+------------------------------------------------------------------+
//|                                                     ZigZaaag.mq5 |
//|                                            Copyright 2024, Hailu |
//|                                             https://www.mql5.com |
//+------------------------------------------------------------------+
#property copyright "Copyright 2024, Hailu"
#property link      "https://www.mql5.com"
#property version   "1.01"
#property indicator_chart_window

#property indicator_buffers 3
#property indicator_plots   1

#property indicator_type1   DRAW_SECTION
#property indicator_color1  clrWhiteSmoke
#property indicator_width1  2

double bufZig[];
double bufOpen[];
double bufClose[];

int hHeiken = 0;
datetime prevDt = 0;

//+------------------------------------------------------------------+
//| Custom indicator initialization function                         |
//+------------------------------------------------------------------+
int OnInit()
{
    // 平均足インジケータを作成
    hHeiken = iCustom(NULL, 0, "Examples\\Heiken_Ashi");
    if (hHeiken == INVALID_HANDLE)
    {
        PrintFormat("[E] Failed to create Heiken_Ashi indicator. [%d]", GetLastError());
        return INIT_FAILED;
    }

    SetIndexBuffer(0, bufZig, INDICATOR_DATA);
    SetIndexBuffer(1, bufOpen, INDICATOR_CALCULATIONS);
    SetIndexBuffer(2, bufClose, INDICATOR_CALCULATIONS);

    PlotIndexSetDouble(0, PLOT_EMPTY_VALUE, 0.0);

    prevDt = 0;

    return INIT_SUCCEEDED;
}
//+------------------------------------------------------------------+
//| Custom indicator iteration function                              |
//+------------------------------------------------------------------+
int OnCalculate(const int rates_total,
                const int prev_calculated,
                const datetime &time[],
                const double &open[],
                const double &high[],
                const double &low[],
                const double &close[],
                const long &tick_volume[],
                const long &volume[],
                const int &spread[])
{
    // 平均足を取得
    CopyBuffer(hHeiken, 0, 0, rates_total, bufOpen);
    CopyBuffer(hHeiken, 3, 0, rates_total, bufClose);

    int start = 1;
    if(prev_calculated == 0)
    {
        bufZig[0] = 0;
    }
    else
    {
        // 直前の陽線群または陰線群の開始位置を、処理開始位置とする
        int il = prev_calculated - 1;
        if (bufOpen[il] >= bufClose[il])
        {
            for (int i = il - 1; i >= 0; i--)
            {
                if (bufOpen[i] < bufClose[i])
                {
                    start = i;
                    break;
                }
            }
        }
        else
        {
            for (int i = il - 1; i >= 0; i--)
            {
                if (bufOpen[i] > bufClose[i])
                {
                    start = i;
                    break;
                }
            }
        }

        start = MathMax(start, 1);
    }

    for(int i = start; i < rates_total; i++)
    {
        int ip = i - 1;

        // 平均足が陽線から陰線に切替わった
        if ((bufOpen[ip] <= bufClose[ip]) && (bufOpen[i] > bufClose[i]))
        {
            double h = high[ip];
            bufZig[ip] = 0;

            // 陽線群の最高値を検索
            for (int j = i - 2; j >= 0; j--)
            {
                if (bufOpen[j] <= bufClose[j])
                {
                    bufZig[j] = 0;

                    if (high[j] > h)
                    {
                        ip = j;
                        h = high[j];
                    }
                }
                else
                    break;
            }

            bufZig[ip] = h;
        }
        // 平均足が陰線から陽線に切替わった
        else if ((bufOpen[ip] >= bufClose[ip]) && (bufOpen[i] < bufClose[i]))
        {
            double l = low[ip];
            bufZig[ip] = 0;

            // 陰線群の最安値を検索
            for (int j = i - 2; j >= 0; j--)
            {
                if (bufOpen[j] >= bufClose[j])
                {
                    bufZig[j] = 0;

                    if (low[j] < l)
                    {
                        ip = j;
                        l = low[j];
                    }
                }
                else
                    break;
            }

            bufZig[ip] = l;
        }
    }

    return rates_total;
}
//+------------------------------------------------------------------+
これをチャートに乗せてみると、次のようになります。
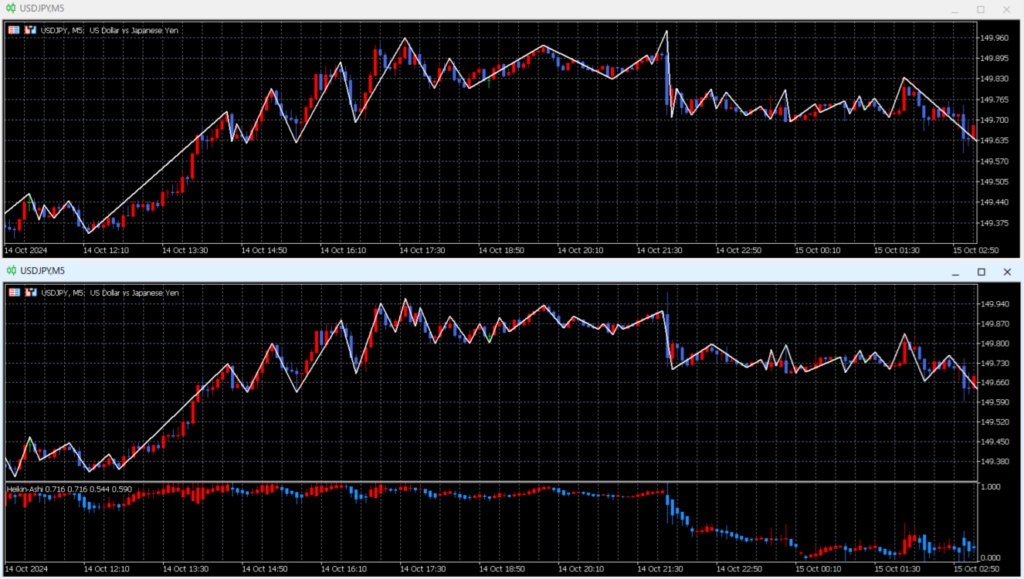
う~ん...悪くはないけど、前回とは別の部分で山・谷が多いのが気になりますね。
今回はここまで。
まあ、これを見るともう一つやってみたいことはありますね...(´-`).。oO
それではまた、アップデートし次第、記事にします。


コメント