

作るもの
Pineスクリプトで、ごく単純なルールで取引するストラテジーを作ってみます。(稼げるルールではない)
エントリーとエグジットのルール、および、ストラテジー実行時に指定できるパラメータは以下のとおり。
ロング条件・内容
- 足確定時に、ローソク足が単純移動平均線を上抜けていたらエントリー (ショートは逆)
- 足確定時に、ローソク足が単純移動平均線を下抜けていたらエグジット (ショートは逆)
- ロット数は固定
- エントリー時に固定幅で指値・逆指値決済注文を入れる
- ポジションは1つしか持たない
パラメータ
- 移動平均線の期間
- ロット数
- 決済指値・逆指値幅
参考サイト
実装
MQL5と違ってめっちゃ短いので、最初にスクリプト全体を示します。
strategy("Sample1")

// パラメータ
int   maPeriod = input.int(20, "MA Period")
int   lots     = input.int(1, "Lots")
float limitPts = input.float(0.1, "Limit Points")
float stopPts  = input.float(0.03, "Stop Points")

// 定数
const string long_id = "long"
const string short_id = "short"

// MA値を取得・描画
float ma = ta.sma(close, maPeriod)
plot(ma, color=color.orange, force_overlay=true)

// 期間
int start_tm = timestamp("GMT+9", 2024, 8, 1, 0, 0, 0)
int end_tm = timestamp("GMT+9", 2024, 8, 31, 0, 0, 0)

if (time >= start_dt) and (time <= end_dt)
    // ポジションなし
    if strategy.opentrades == 0
        // 上抜けた
        if ta.crossover(close, ma)
            // 買いエントリー
            strategy.entry(long_id, strategy.long, lots * 10000, close + limitPts, close - stopPts)

        // 下抜けた
        else if ta.crossunder(close, ma)
            // 売りエントリー
            strategy.entry(short_id, strategy.short, lots * 10000, close - limitPts, close + stopPts)

    // ポジションあり
    else
        // エントリーIDを取得
        string id = strategy.opentrades.entry_id(0)

        // ロング保有中で下抜けた、または、ショート保有中で上抜けた
        if ((id == long_id) and (close < ma)) or ((id == short_id) and (close > ma))
            // 決済
            strategy.close(id)
最低限、これだけ。
みじかっ‼
では、詳細を説明します。
スクリプトの宣言
最初の strategy( ...) は、このスクリプトがストラテジーであることの宣言です。
インジケータの場合は、indicator( ...) です。
それぞれの定義は以下のとおり。
strategy(title, shorttitle, overlay, format, precision, scale, pyramiding, calc_on_order_fills, calc_on_every_tick, max_bars_back, backtest_fill_limits_assumption, default_qty_type, default_qty_value, initial_capital, currency, slippage, commission_type, commission_value, process_orders_on_close, close_entries_rule, margin_long, margin_short, explicit_plot_zorder, max_lines_count, max_labels_count, max_boxes_count, calc_bars_count, risk_free_rate, use_bar_magnifier, fill_orders_on_standard_ohlc, max_polylines_count, dynamic_requests) → voidindicator(title, shorttitle, overlay, format, precision, scale, max_bars_back, timeframe, timeframe_gaps, explicit_plot_zorder, max_lines_count, max_labels_count, max_boxes_count, calc_bars_count, max_polylines_count, dynamic_requests) → voidうん。いまの段階で全部の引数の意味を調べる気はおきませんね。
とりあえず、最初の title だけ指定しておけば大丈夫です。
他は、使いたくなったときに調べましょう。
スクリプトの実行タイミング
Pineスクリプトは、デフォルトでは、ローソク足が確定する度に 実行されます。
じゃあ、変数の値を持ち越したい場合はどうするの?
と思いますよね。
その場合は、var を頭につけて宣言します。
< 記述例 >
strategy("...")

var int n = 0

n := n + 1
log.info("n={0,number,#}", n)
こう書くと、strategy が呼ばれるたびに、n が +1 されます。
var を書かないと、ログには常に “n=1” が出力されます。
今回は使いませんでしたが、ポジションの保有情報などを変数で保持しておきたいなどのケースで使用できそうです。
パラメータ
int   maPeriod = input.int(20, "MA Period")
int   lots     = input.int(1, "Lots")
float limitPts = input.float(0.1, "Limit Points")
float stopPts = input.float(0.03, "Stop Points")input.〇〇〇関数は、 スクリプト実行時のパラメータになります。
個人的には
スクリプトを直接書き換えればよくない?
という気がしますが、せっかくなので使ってみました。
きっと、オリジナルインジケータなどを公開する人が使うんでしょう。
移動平均線
// MA値を取得・描画
float ma = ta.sma(close, maPeriod)
plot(ma, color=color.orange, force_overlay=true)単純移動平均値は、ta.sma関数で取得できます。
指数平滑移動平均値は、ta.ema関数を使用します。
ta.sma関数と ta.ema関数の定義を以下に示します。
ta.sma(source, length) → series floatta.ema(source, length) → series floatsource には close変数を指定します。
close変数には、終値が入っています。
高値なども指定できそうですが、オリジナルインジケータを作るときでなければ使わないでしょうから、ここでは触れません。
length には期間を指定します。
また、動作確認しやすいように、移動平均線をチャートに重ねて描画しています。
インジケータの値の描画には、plot関数を使用します。
plot(series, title, color, linewidth, style, trackprice, histbase, offset, join, editable, show_last, display, format, precision, force_overlay) → plotいろいろ引数がありますが、とりあえず series, color, force_overlay だけ覚えておけば、最低限使えます。
series には MA値を指定します。
color には、色を指定します。
色は、Pineエディタ上で「color.」と入力すると候補が表示されます。
また、#rrggbb という形式でRGB値を指定できます。
この引数を省略した場合は、color.blue になります。
force_overlay には、チャートに重ねるかどうかを指定します。
true を指定すると、チャート上に描画します。
false を指定すると、オシレータ系インジケータのようにチャートの下に領域が用意されて、描画されます。
この引数を省略した場合は、false になります。
移動平均線を描画しなくていい場合は、後述するテスト期間の節の if分の中で MA値を取得しても構いません。
ただし、plot関数はトップレベルのスコープにしか記述できないので、移動平均線を描画したい場合は if分の外で MA値を取得してください。
テスト期間
int start_tm = timestamp("GMT+9", 2024, 8, 1, 0, 0, 0)
int end_tm = timestamp("GMT+9", 2024, 8, 31, 0, 0, 0)

if (time >= start_dt) and (time <= end_dt)
...
TradingViewでは、テスト期間をスクリプトで指定します。
timestamp関数で開始日時と終了日時を作成し、開始日時 ≦ time変数 ≦ 終了日時 となっているときに取引するようにします。
timestamp関数の定義は以下のとおりです。
timestamp(timezone, year, month, day, hour, minute, second) → simple inttimezone は、日本なら “GMT+9” を指定します。
year, month, day, hour, minute, second は、日時の数値を指定します。
time変数には、現在の(確定した最後の) ローソク足の開始時刻が設定されています。
終了時刻は time_close変数に入っています。
エントリー
// ポジションなし
if strategy.opentrades == 0
    // 上抜けた
    if ta.crossover(close, ma)
        // 買いエントリー
        strategy.entry(long_id, strategy.long, lots * 10000, close + limitPts, close - stopPts)

    // 下抜けた
    else if ta.crossunder(close, ma)
        // 売りエントリー
        strategy.entry(short_id, strategy.short, lots * 10000, close - limitPts, close + stopPts)
保有ポジションの有無を確認
strategy.opentrades変数には保有ポジション数が設定されているので、この値により、ポジションを保有しているかどうかを判断できます。
注文条件の判定
ローソク足が移動平均線を上抜けたかどうかは ta.crossover関数で判断できます。
ta.crossover関数の定義は以下のとおり。
ta.crossover(source1, source2) → series boolta.crossover関数は、以下の条件を満たす場合に true を返します。
- 現在の (確定した最後の) source1 が source2 より上
- 1本前の source1 が source2 以下
同様に、下抜けたかどうかは ta.crossunder関数で判断できます。
ta.crossunder関数の定義は以下のとおり。
ta.crossunder(source1, source2) → series boolta.crossunder関数は、以下の条件を満たす場合に true を返します。
- 現在の (確定した最後の) source1 が source2 より下
- 1本前の source1 が source2 以上
どちらも、source1 に close変数、source2 に上で取得したMA値を指定します。
成行の新規注文
エントリーには strategy.entry関数を使用します。
strategy.entry関数の定義は以下のとおり。
strategy.entry(id, direction, qty, limit, stop, oca_name, oca_type, comment, alert_message, disable_alert) → voidこれも、最低限の引数だけ指定します。
id は注文のIDです。文字列で指定します。
この例では、ロングは冒頭で定義した定数の “long”、ショートは “short” を指定しています。
direction は、買い注文なら strategy.long、売り注文なら strategy.short を指定します。
qty は取引通貨量です。
この例では、パラメータの lots * 10000 を指定しています。
limit と stop は、Take profit と Stop loss です。
この例では、現在の終値とパラメータの limitPts(指値幅)、stopPts(逆指値幅) から算出したものを指定しています。
エグジット
// エントリーIDを取得
string id = strategy.opentrades.entry_id(0)

// ロング保有中で下抜けた、または、ショート保有中で上抜けた
if ((id == long_id) and (close < ma)) or ((id == short_id) and (close > ma))
    // 決済
    strategy.close(id)
決済注文の前に、現在保有しているポジションの注文IDを取得します。
注文IDは strategy.opentrades.entry_id関数で取得できます。
strategy.opentrades.entry_id関数の定義は以下のとおり。
strategy.opentrades.entry_id(trade_num) → series stringtrade_num は、0起算の注文インデックスです。
この例ではポジションを1つしか持たないので、0(ゼロ)を指定しています。
決済注文は strategy.close関数で行います。
strategy.close関数の定義は以下のとおり。
strategy.close(id, comment, qty, qty_percent, alert_message, immediately, disable_alert) → voidid には、上で取得した注文IDを指定します。

実行してみる
TradingView のPineエディタでスクリプトを保存すると、自動で strategy (や indicator) のスクリプトを実行してくれます。
<実行例> ※ 画像をクリックすると、大きく表示されます。
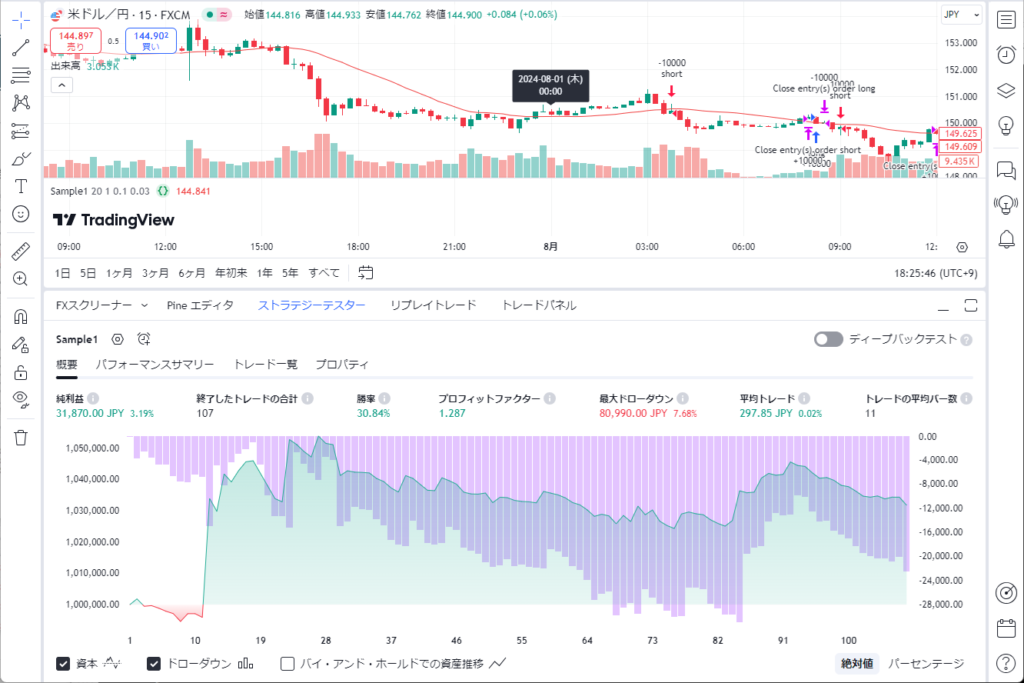
ご覧のとおり、買い注文の箇所を青矢印、売り注文の箇所を赤矢印、決済注文の箇所を紫矢印で示してくれます。
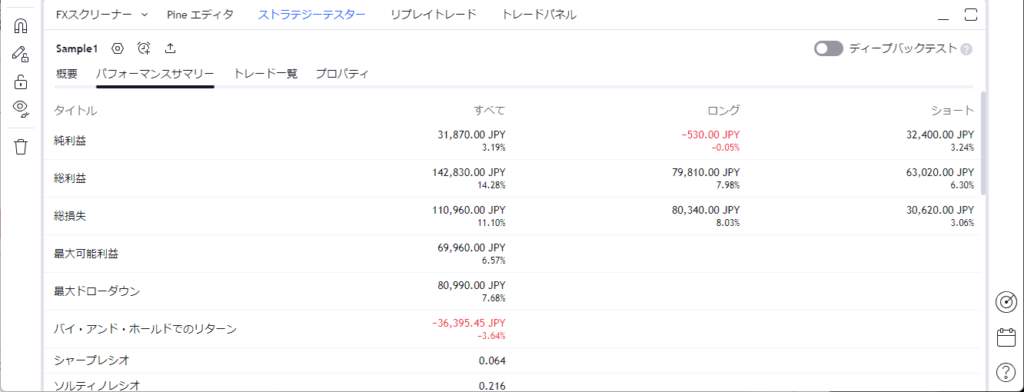
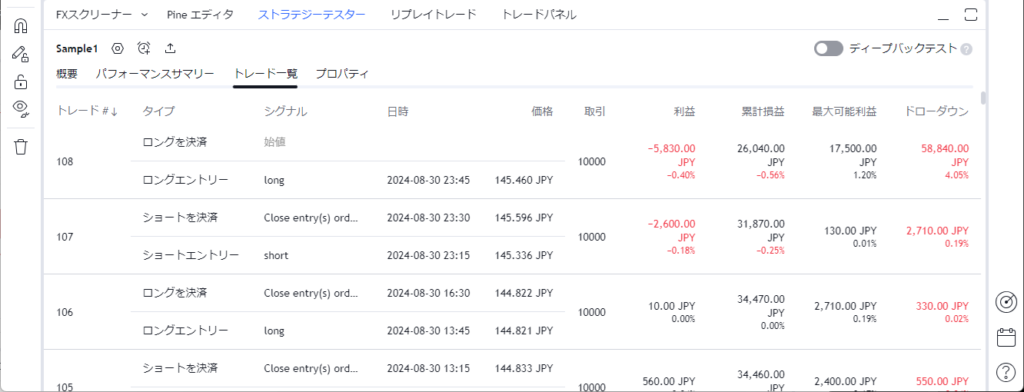
下のストラテジーテスタータブには、テスト結果をいろいろ表示してくれます。
なんだろう、すごくらく。
自動売買しないのなら、MT5よりTradingView のほうがいいかもね。
コメント